The starting point
Schachinger generates large amounts of data every day: parcel volumes and weights, revenue from freight and surcharges, costs for delivery, staff and operations.
The data was there, but spread across many systems, from Excel and clearing to Qlik. Whether a single customer was profitable could only be answered with a lot of manual work.
Our approach
We did not start with finished requirements, but with the question of what Schachinger could get out of the data it already had.
Data landscape
We mapped which systems deliver which data and where the links were missing.
Ideas & goals
In August 2024 we presented three project ideas to Schachinger and prioritised them together.
Design in Figma
We designed the dashboard first, so it was clear which figures had to be visible at a glance.
Development
With Elixir LiveView we built a reactive interface that handles large amounts of data smoothly.
From revenue to contribution margin 4
Costs are deducted from a customer's revenue step by step. This shows not only whether a customer is profitable, but also where the money goes. Click on a step to see which costs it contains.
Domestic freight and surcharges, including the diesel surcharge. Plus parcel volumes and weight in the selected period.
Everything directly related to pickup and delivery.
- Clearing and fees
- Tolls and line haul
- Couriers for pickup and delivery
- Local hauliers
- Unloading and materials
Staff costs, allocated proportionally to the customer.
- Agency staff
- Employees
Operations, administration and risk.
- Rent, leasing, maintenance
- Insurance and damage claims
- Bad debts
- IT, consulting, marketing, administration
What is left after all costs and depreciation.
Sample figures from the design, not real customer data.
One dashboard instead of many spreadsheets
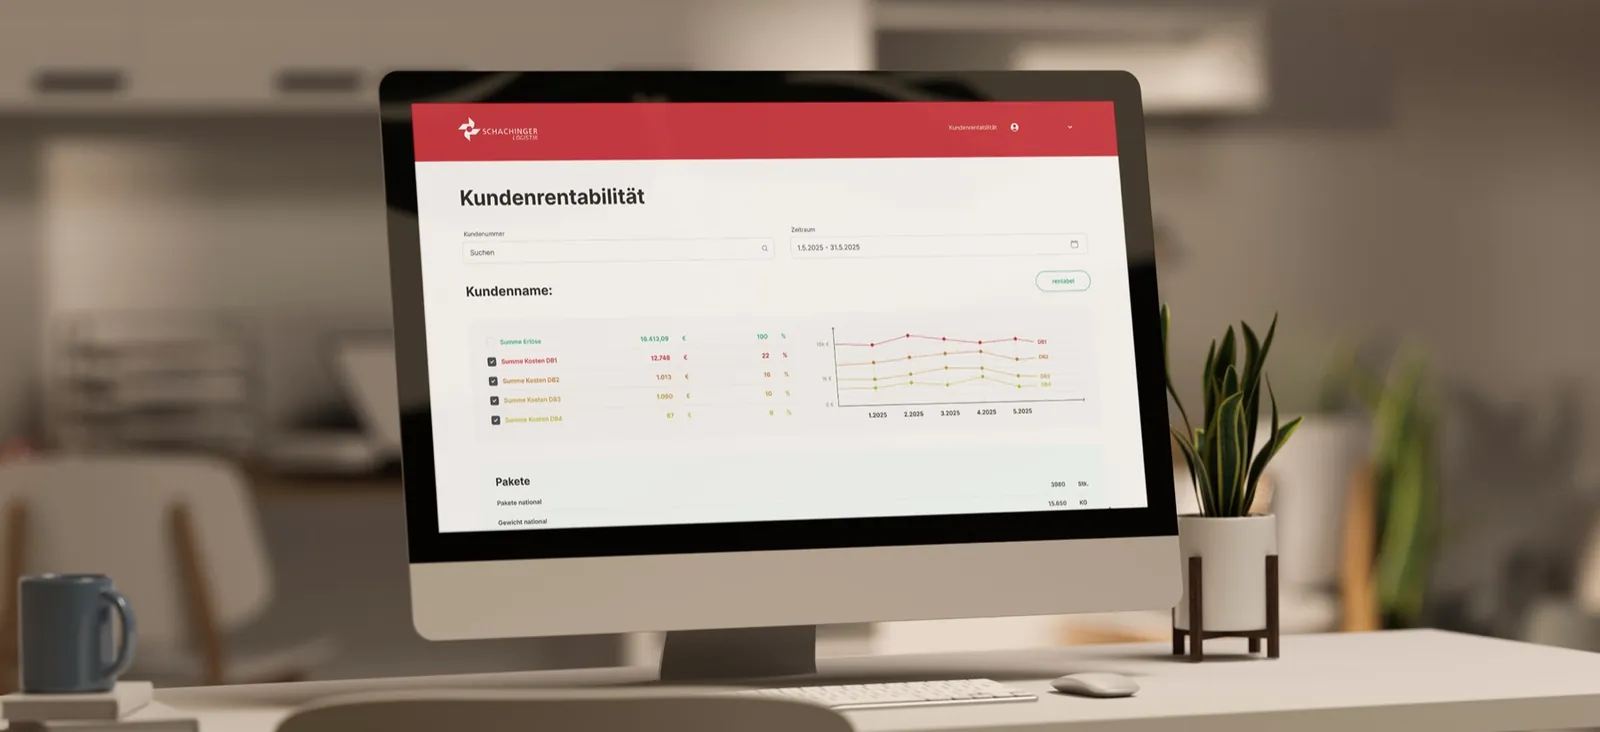
Enter the customer number, choose a period, done. At the top you see revenue and contribution margins with their trend over the months, below that parcels, revenue and all costs. Every cost level can be expanded, down to the individual cost centre.
A badge shows straight away whether the customer was profitable in the selected period.
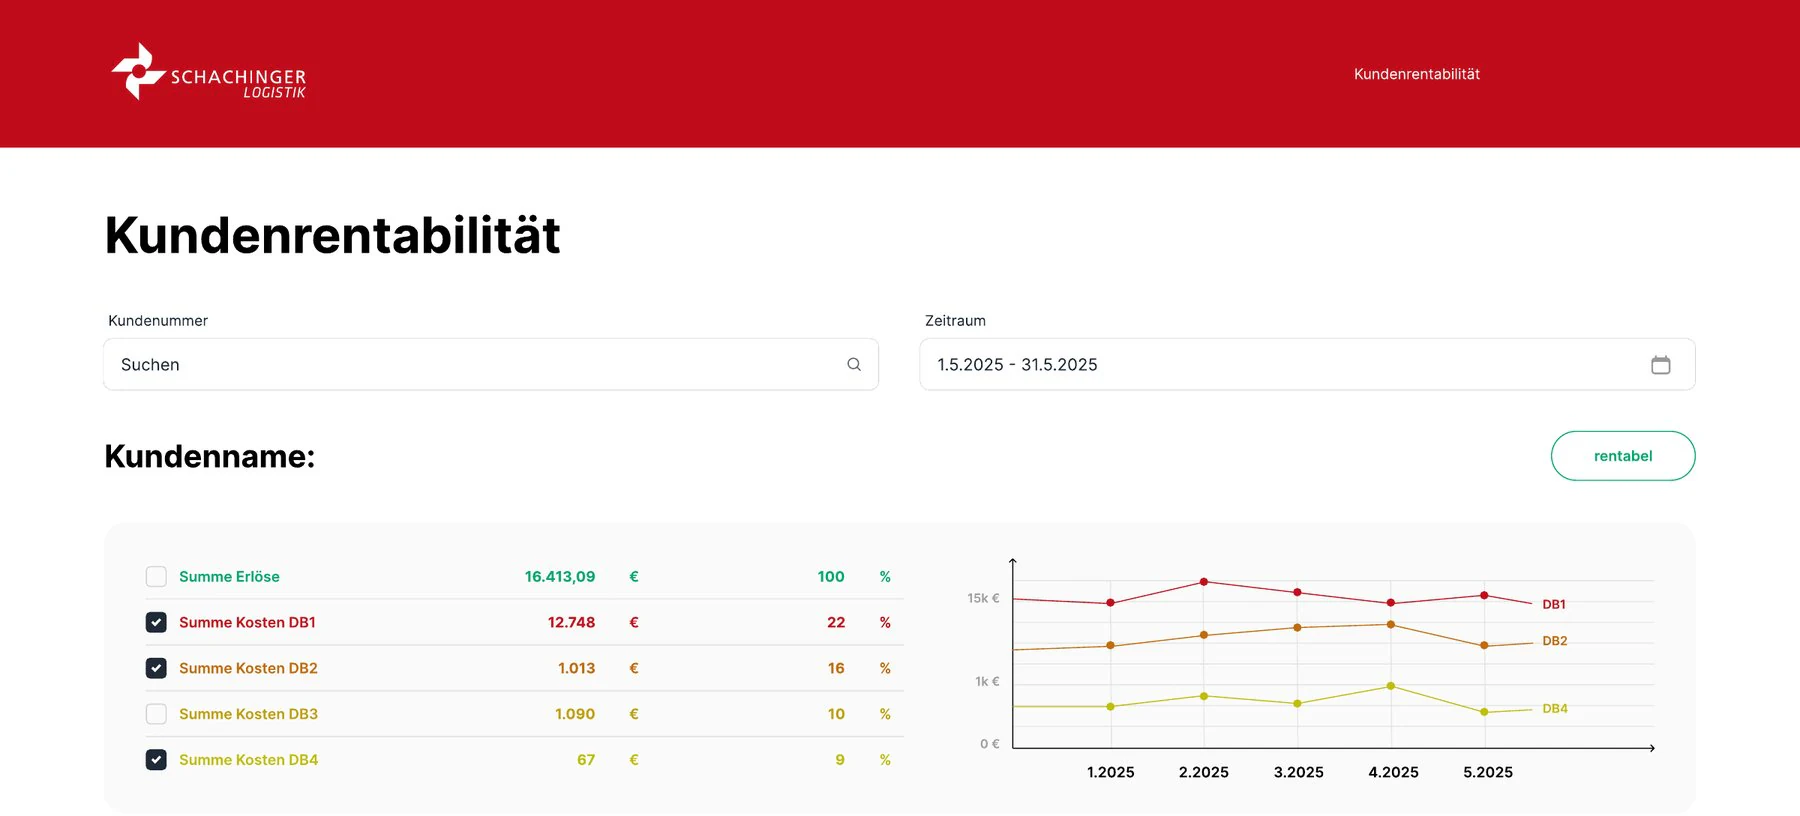
Everything at a glance
Revenue, costs and key figures per customer in one overview.
Trend over months
Developments become visible in the chart, levels can be shown or hidden.
Down to the detail
Every level expands, down to cost centres and revenue types.
Filter and search
By customer number and any period.
Calculated automatically
Contribution margins and shares come straight from the raw data, without manual work.
Profitable or not
A clear signal per customer, without having to compare figures first.
Better decisions about customers
Customers can be grouped by their profitability.
Price changes can be backed up with figures.
Decisions about key customers rest on a clear basis.
The data provides the basis for quotes to new customers.
More ideas from the analysis
Customer profitability was the first of three projects we worked out with Schachinger.
You might also be interested in
HF Elektrik
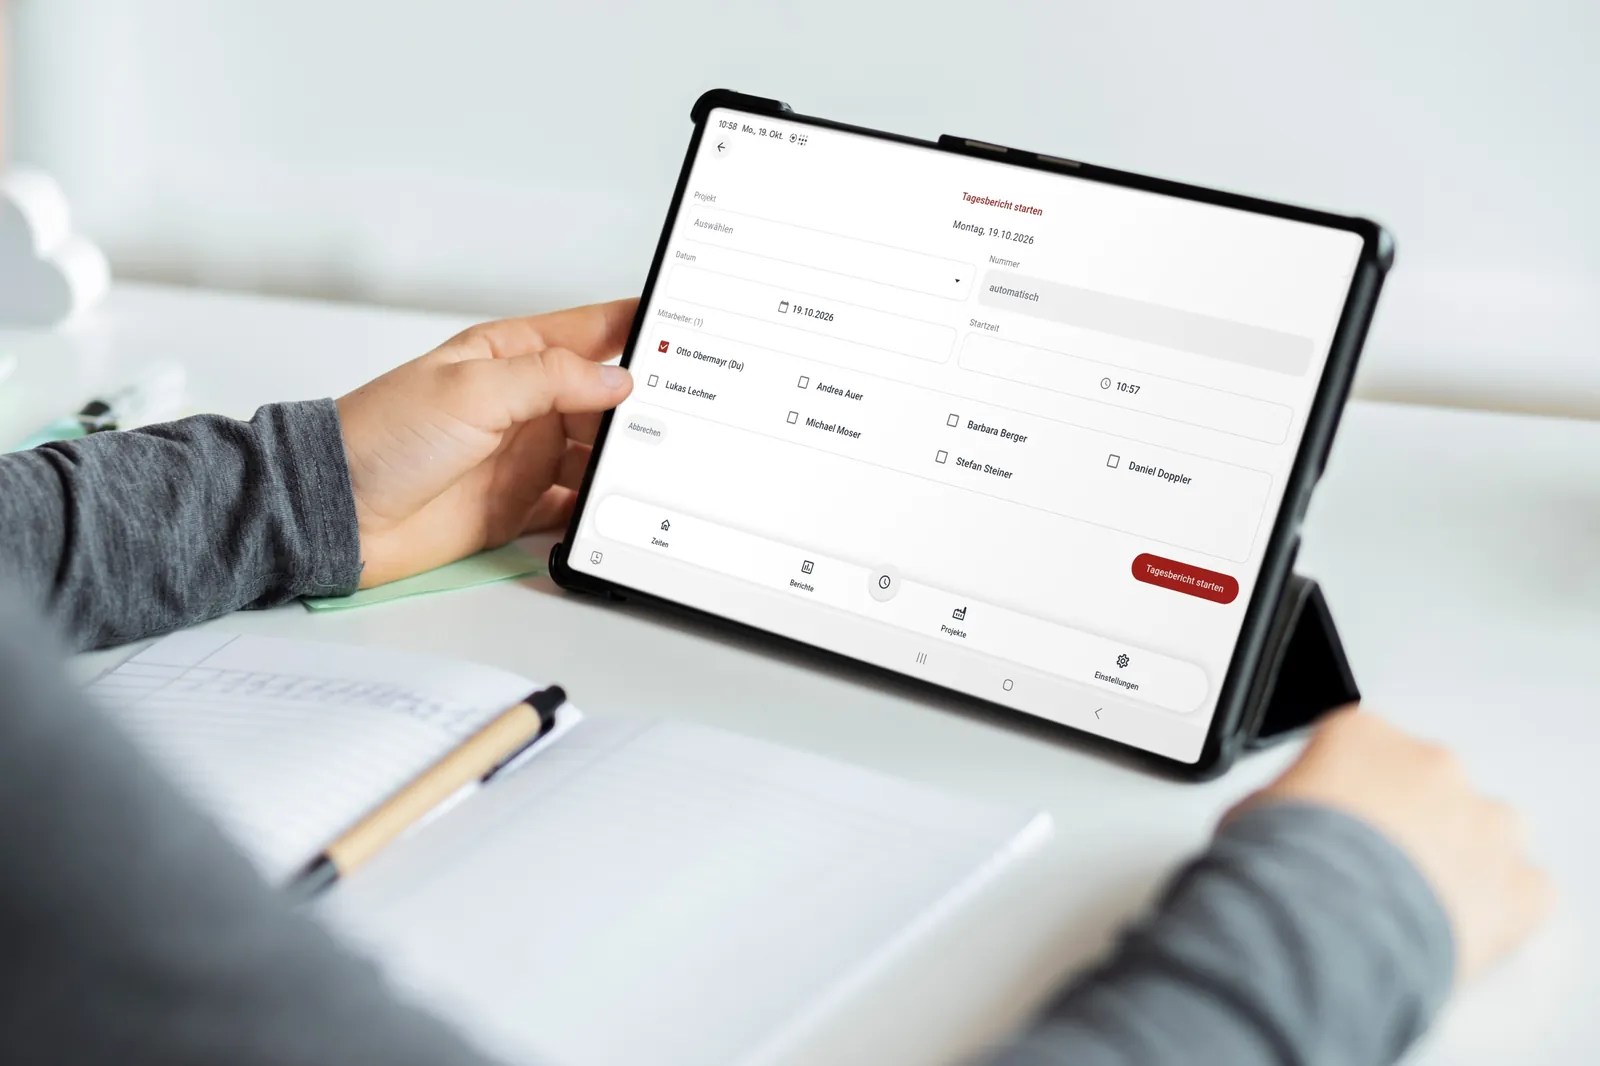
Work reports on paper, times recorded twice, invoices copied by hand for days. Today the field technicians fill in their daily report on the tablet, even offline, and the times flow into time tracking automatically, including surcharges.
View project →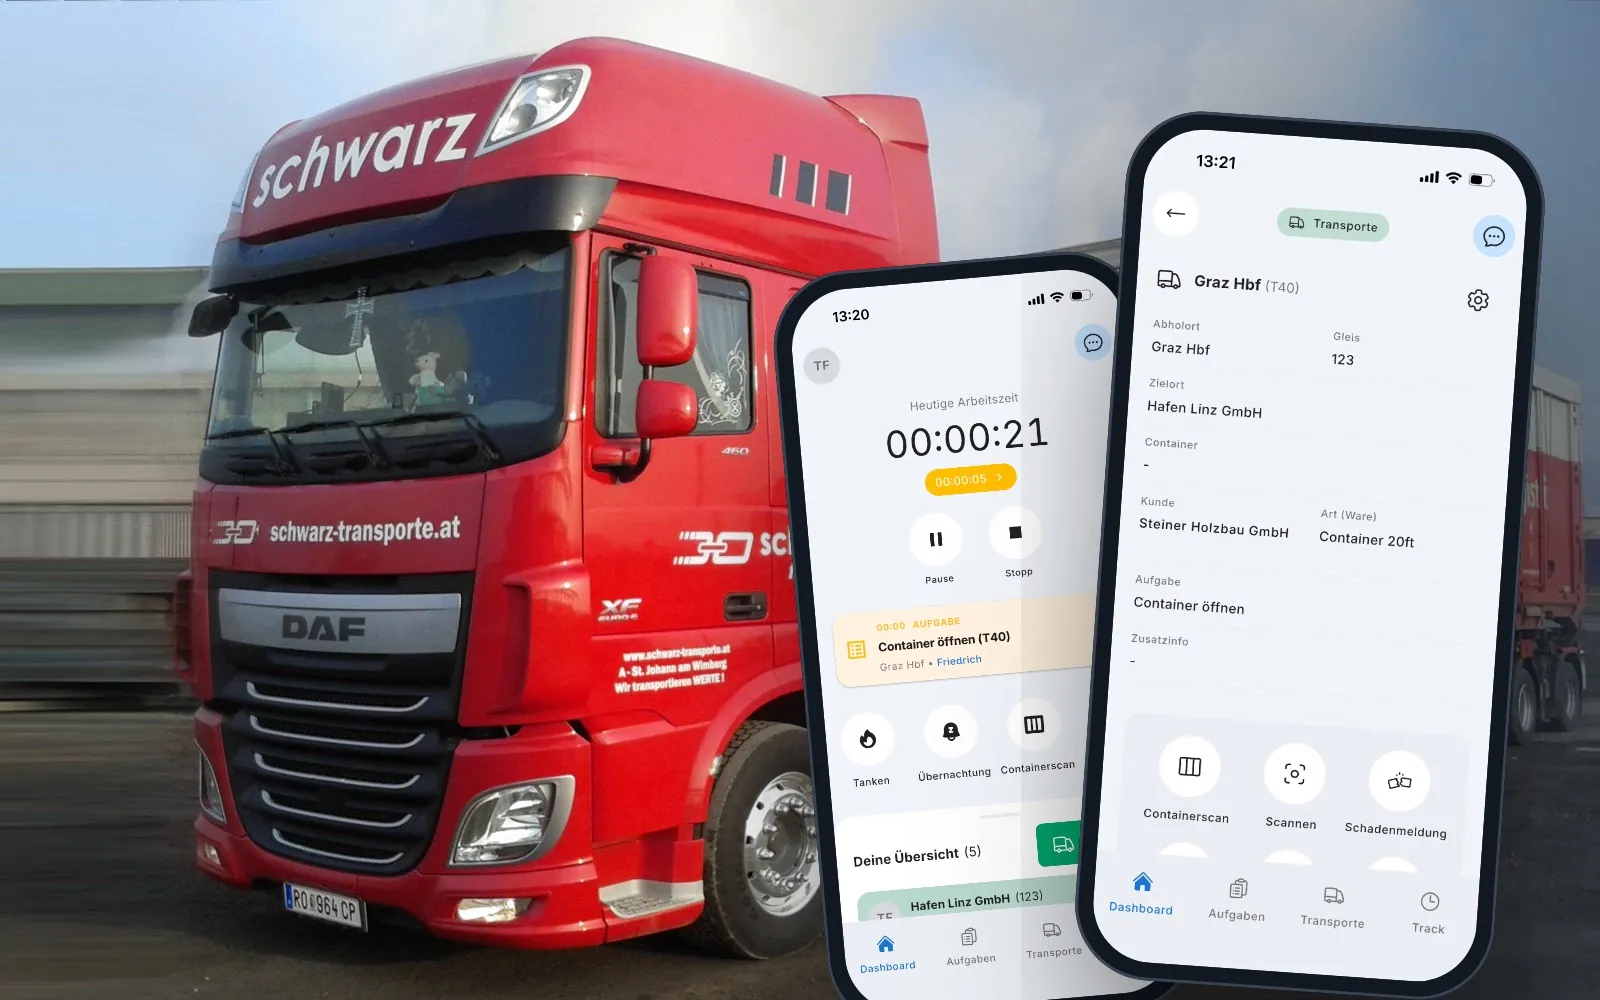
CargoCommander
Orders through various channels, paper and Excel, credit notes matched by hand. CargoCommander connects the ÖBB Rail Cargo Group, dispatch and drivers on one platform.
View project →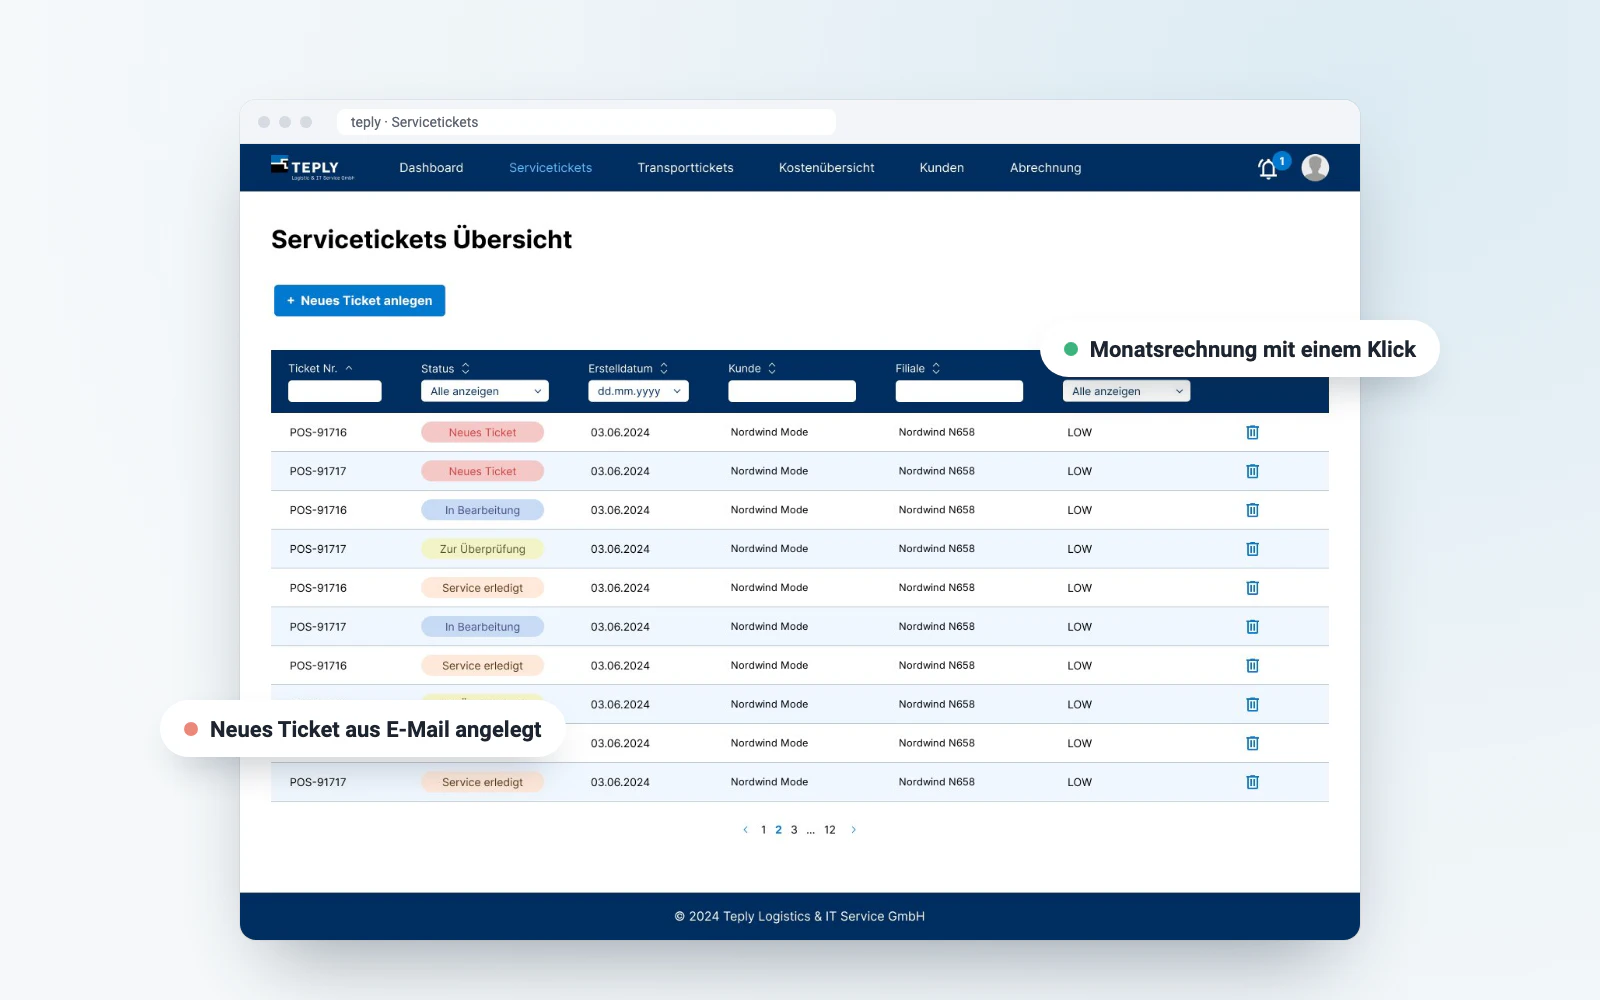
Teply ticket system
For Teply, a specialist in installations and service call-outs, we built a ticket system that handles customer requests, repair jobs and the coordination of technicians digitally, right through to simple invoicing.
View project →Any questions?
We are happy to tell you more about the project and what parts of it could work for you too.